Insights into Water Quality Data with Our Monitoring Program
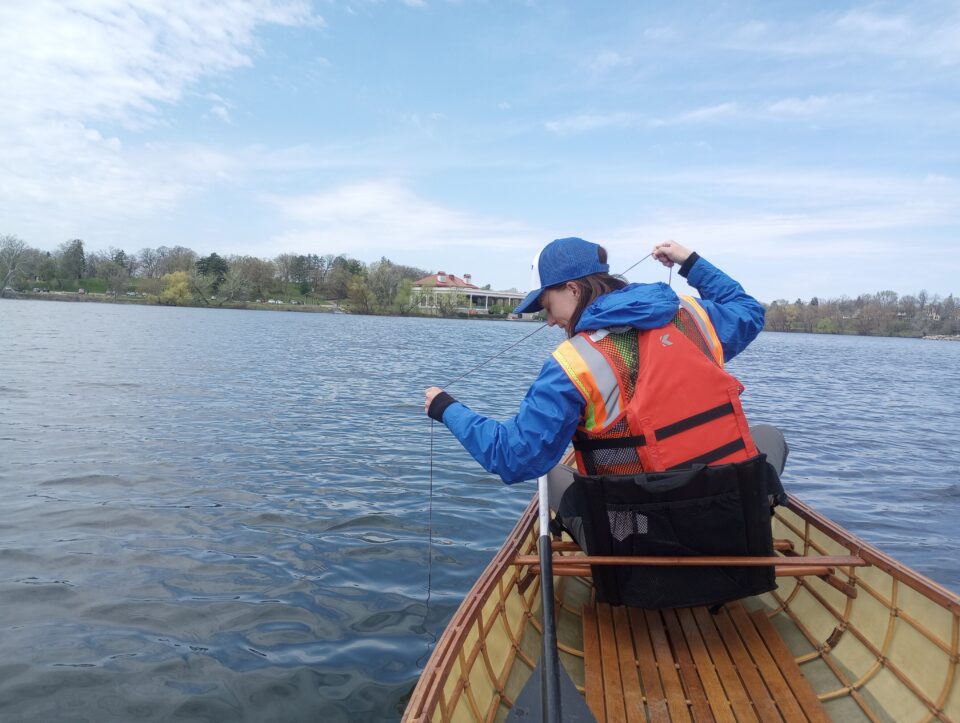
You’re out walking around Como Lake on a beautiful spring day. The birds are singing, and the native plants around the shoreline are greening. You see us, Capitol Region Watershed District (CRWD) monitoring staff, in a canoe with clipboards and equipment in the middle of the lake. We are on a weekly monitoring visit to download data and record water clarity. But you wonder, what do we do with all that data?
Monitoring Program
Our monitoring program gathers data to assess the health of the District’s lakes and wetlands, measure stormwater pollutants, evaluate our projects, and identify problem areas.
From stormwater to lakes to special research projects like microplastics monitoring, we collect data year-round. During the primary monitoring season of approximately April – October, we collect samples from storm sewer tunnels, projects, lakes and wetlands.
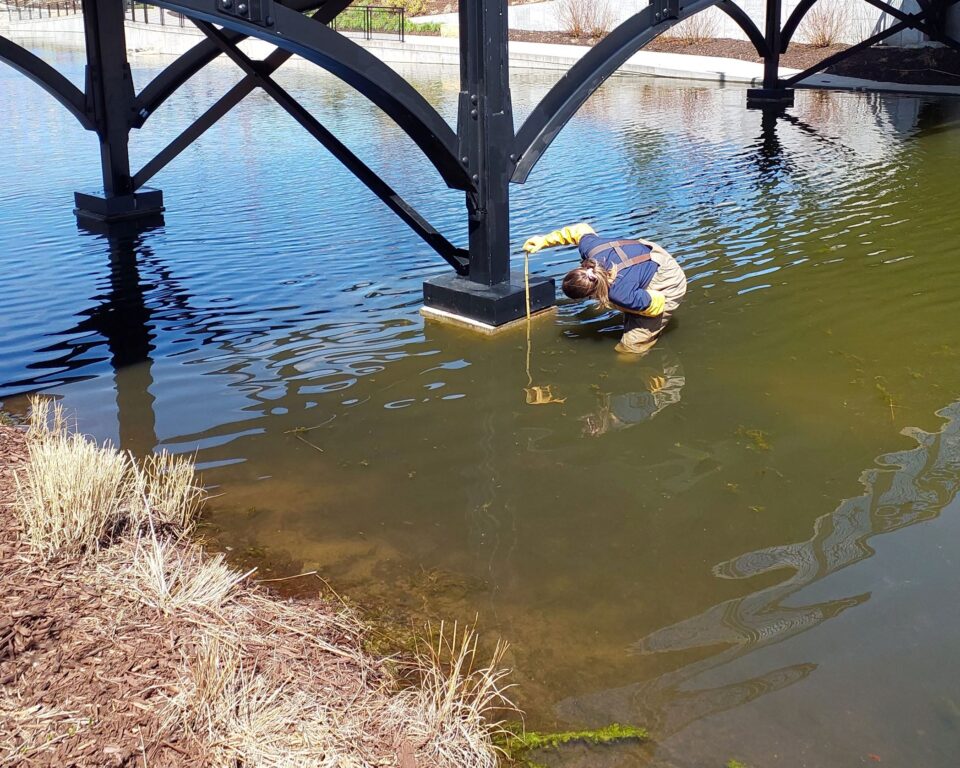
When we are not collecting samples, we gather data on water levels in lakes and stormwater ponds, survey wetland and shoreline plants, and download continuous monitoring data from the buoys in Como Lake.
In the winter season, from November to March, we focus on compiling and analyzing all the data from the previous monitoring season, and cleaning and repairing our monitoring equipment. Check out our monitoring areas, related reports and summaries to understand what we are working on.
Water Quality Indicators
We monitor a variety of pollutants along with other things to understand water quality in our lakes and stormwater systems. You’ll see the following throughout this article.
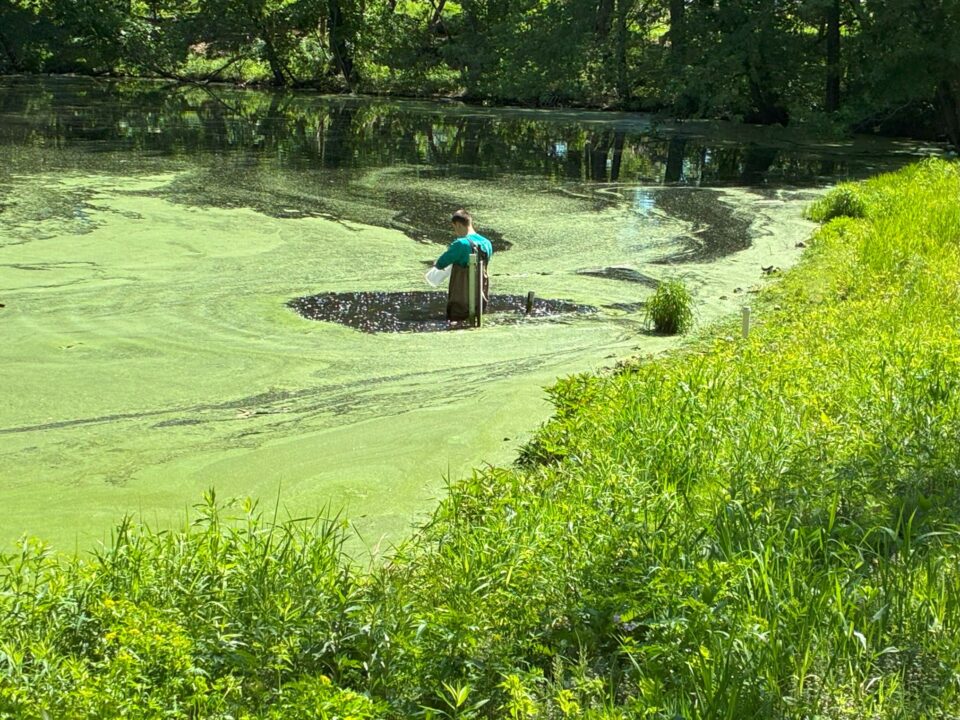
Nutrients – Stormwater runoff often has nutrients like nitrogen and phosphorus from leaves, grass clippings, pet waste and fertilizers. Too many nutrients in water can accelerate plant growth, and fuel harmful algal blooms that lead to lower oxygen levels in lakes, which harms aquatic life.
Sediment – Stormwater runoff can carry sediment to our water bodies, which increases turbidity, reduces sunlight, and can include other pollutants in it like nutrients or heavy metals.
Water clarity – We measure the water clarity of our lakes with a Secchi disc, a black and white disc lowered into the water until it’s no longer visible. The deeper you can see the Secchi disc in the water, the better the water clarity, the more light can penetrate and help native plants to grow.
Chloride – Too much chloride in a water body harms plants and wildlife and can impact our sources of drinking water. Chloride pollution in CRWD primarily comes from de-icing salt used on roads, parking lots and sidewalks and then carried to water bodies via storm drains.
Chlorophyll-a – Used to measure the amount of algae and cyanobacteria in our lakes.
Dissolved oxygen – The amount of oxygen in the water that is critical for aquatic life.
Conductivity – A way for us to measure the amount of chloride in our lakes.
Lakes
We monitor all five lakes in our district: Como Lake, Crosby Lake, Little Crosby Lake, and Loeb Lake in Saint Paul and Lake McCarrons in Roseville. You can learn more about them on our Lakes page.
Ramsey County Public Works samples the lakes twice a month from April to October to monitor water quality indicators, including nutrients, water clarity, and chlorophyll-a. In 2024, Ramsey County Soil and Water Conservation Division worked with CRWD to conduct surveys of aquatic plants on all five lakes.
We perform additional monitoring at Como Lake to help us evaluate our goals in the Como Lake Management Plan. We have three in-lake monitoring stations to measure dissolved oxygen, pH, temperature, and conductivity near the lake bottom, which helps us understand the effectiveness of our alum treatment and how these parameters change throughout the season.
We also monitor the native aquatic plants we transplanted in recent years, along with tracking the reduction of curly-leaf pondweed following annual herbicide treatments. Visit Como Lake Aquatic Plant Management to learn more about the plants in the lake.
2024 Lakes Summary
After several years of drought, the summer of 2024 produced more rain, bringing increased nutrients, sediment, and other pollutants to District lakes and raising lake levels higher than usual. The pollutant loads led to a decline in water quality compared to 2023. But our lakes still had some wins despite the frequent rain. Como Lake’s native plant population continued to improve. Lake McCarrons and Loeb Lake met the state standards for total phosphorus, chlorophyll-a and Secchi depth. You can read more in the 2024 Lakes Summary Report PDF.
Stormwater
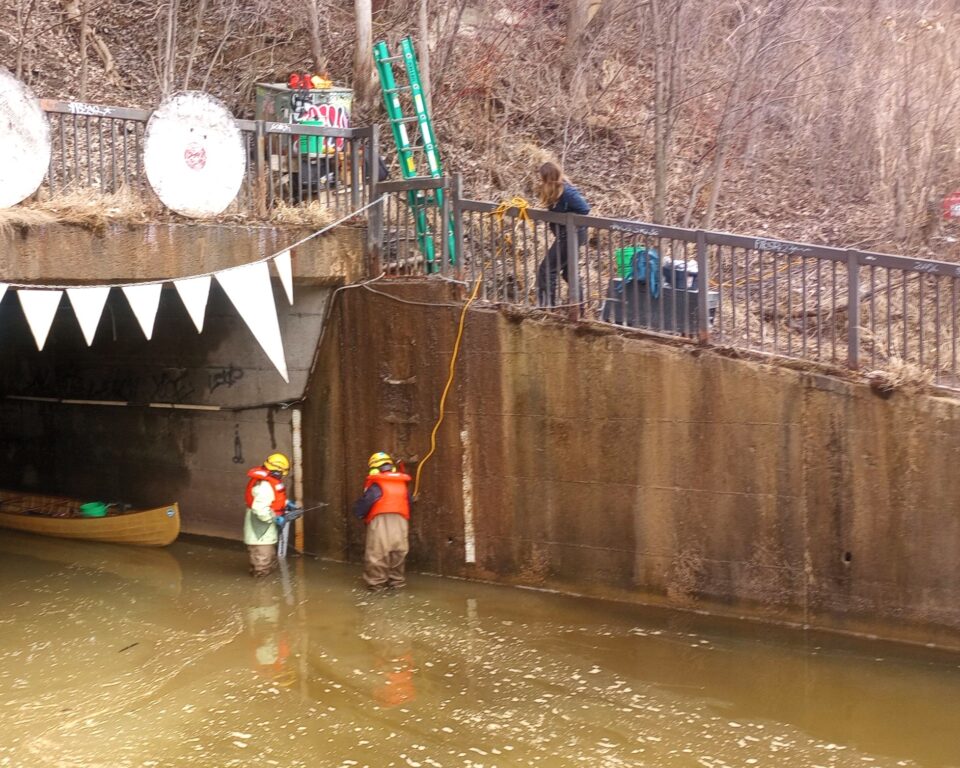
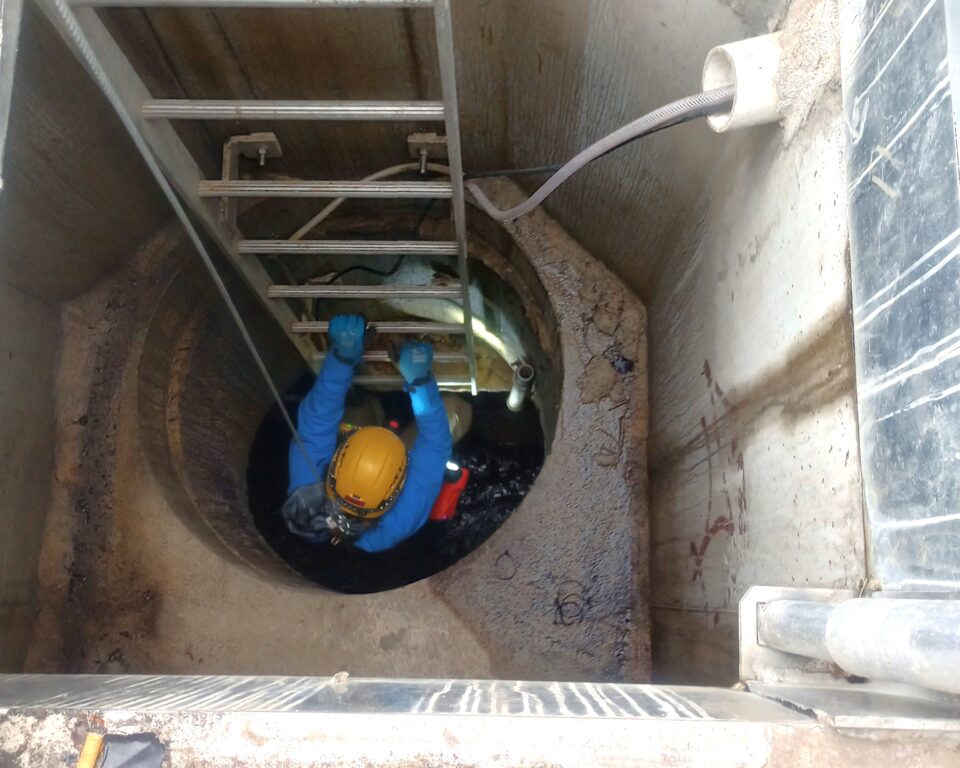
We collect a variety of samples and data within storm sewer pipes and outfalls, stormwater ponds, precipitation stations, and our projects to understand the impacts of stormwater on our lakes, wetlands, and ultimately the Mississippi River. We analyze the samples for several types of pollutants, including phosphorus and sediment. In 2024, CRWD monitored over 80 stations and submitted 767 water quality samples for analysis!
CRWD shares stormwater data with the City of Saint Paul, as well as the Minnesota Pollution Control Agency for two major regional projects: the Twin Cities Metropolitan Area Chloride Project and the Upper Mississippi River Total Maximum Daily Load.
2024 Stormwater Summary
Overall, all our monitoring stations had more water flowing through them in 2024 due to above-average rain from April to July. More water resulted in increased pollution levels. Chloride concentrations were highest during snowmelt periods, emphasizing the seasonal impact of salt used to melt ice on roads, sidewalks, and parking lots. E. coli levels were much higher in stormflow than groundwater baseflow, with most stormflow samples exceeding state standards. You can read more in the 2024 Stormwater Summary PDF.
Climate
We collect precipitation data and analyze data from other climate monitoring stations. We analyze temperature, growing season precipitation, unusual weather events, drought, and other relevant data in an annual Climatological Summary. Tracking this information helps us broaden our understanding of the changing climate and its impacts on our water resources and projects.
2024 Climatological Summary
We recorded 32.1 inches of rain in 2024, half an inch more than the 30-year normal. The bulk of the precipitation was during the May-September growing season, which ended the multi-year deficits that impacted tree and plant growth over the past several years. During 2024, the entire state was also free of all drought conditions after three years of prolonged drought throughout Minnesota. We experienced unusual and record-breaking weather events in 2024, including the warmest winter (2023-2024) and autumn, and the fourth wettest June. You can read more in the 2024 Climatological Summary PDF.
Special Research Projects
We work on special research projects relevant to our watershed like the recent microplastics sampling project. Our Watershed Management Plan (Water Quality Goal 11) identified the need to investigate contaminants of emerging concern (including microplastics) in District water bodies. We recently completed a three-year microplastics sampling project.
Microplastics Sampling
Microplastics are plastic particles smaller than 5 millimeters (mm) in diameter. Manufactured products, the breakdown of larger plastic materials, car tires, and synthetic fibers are the primary sources of microplastics. This topic has gained recent attention as a pressing environmental concern due to the human health risks and harm to aquatic life.
From 2020 to 2023, we collected water samples from precipitation, lakes, and stormwater at six locations. We used an external lab to identify, measure and count the microplastics in the samples. The results show microplastics are abundant in our watershed. Microplastics were found at all monitoring locations and in rain and snow samples. The majority of microplastics found in CRWD samples were from synthetic textiles and car tire shreds.
2025 Monitoring Season
With the warm weather, we have installed all our seasonal monitoring equipment and are off and running with another fun and busy monitoring season!
We will continue to collect water samples from all our stations, including from key projects installed in the District to evaluate the performance of these systems as well as understand when maintenance needs to occur. These projects include:
- Parkview Center School
- Upper Villa Park
- Seminary Pond
- Como Golf Course
- Curtiss Pond
- Highland Bridge and
- Willow Reserve
We are excited to see what this monitoring season brings and will be ready to share our latest data summaries and reports with you next year. Wave hello if you see us in the field (or on Como Lake) and send us any questions you have about our work