Winter monitoring at Como Lake
Introduction
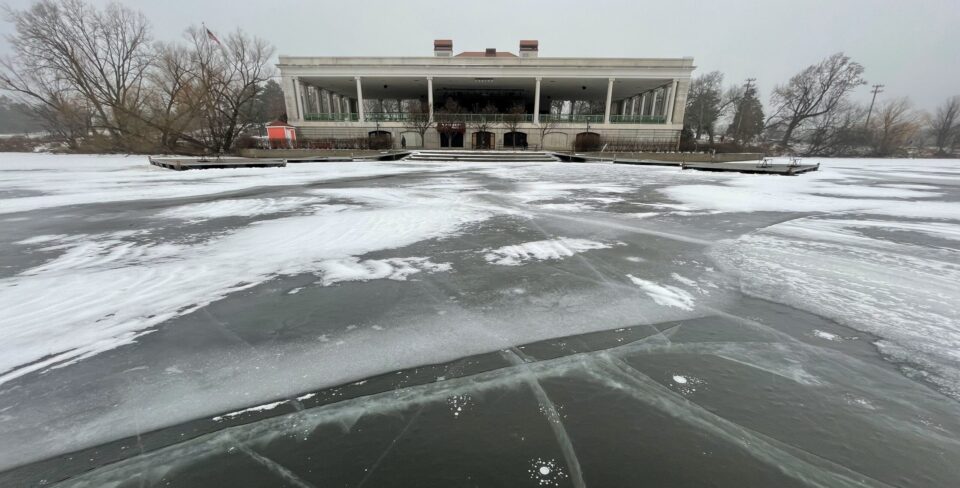
It’s a deary late January morning in Saint Paul. After a cold snap with subzero windchills the week before, this morning is comparatively warm at around 30 degrees. A month earlier, Como Lake had an unprecedented December ice-off following the initial ice-on in late November. On this day, the lake is completely covered in ice again. The glassy, dark ice dotted with white frozen air bubbles is known as ‘wild ice,’ which forms when cold temperatures combine with a lack of snow. Wild ice is not common in Saint Paul or at Como Lake.
Winter Monitoring Process
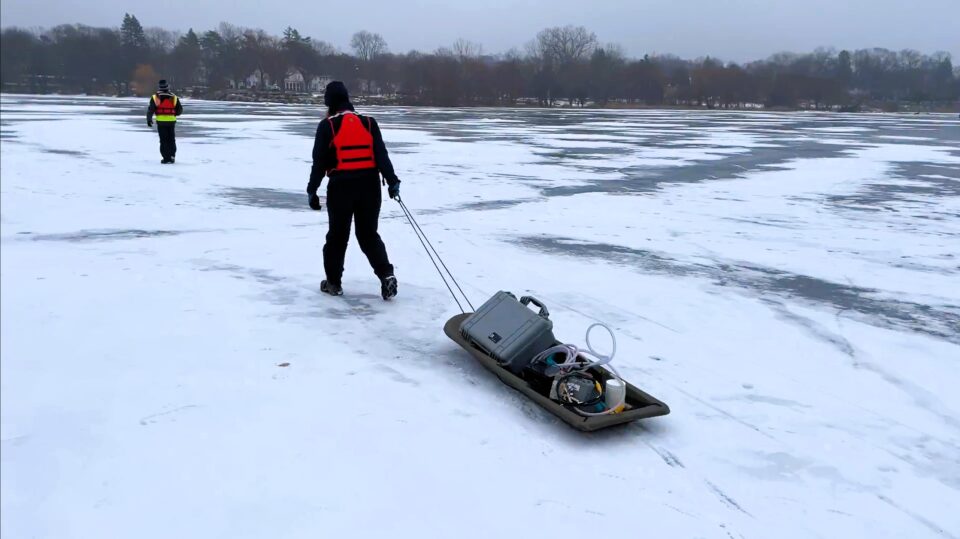
Marta, Elizabeth, and Eoghan from Capitol Region Watershed District’s (CRWD) monitoring & research division load the monitoring truck with a children’s plastic sled, warm boots, life jackets, and other equipment as they prepare for the first winter monitoring visit to Como Lake of the season. With the prolonged warm-up expected, it could be the only winter monitoring trip at the lake this season.
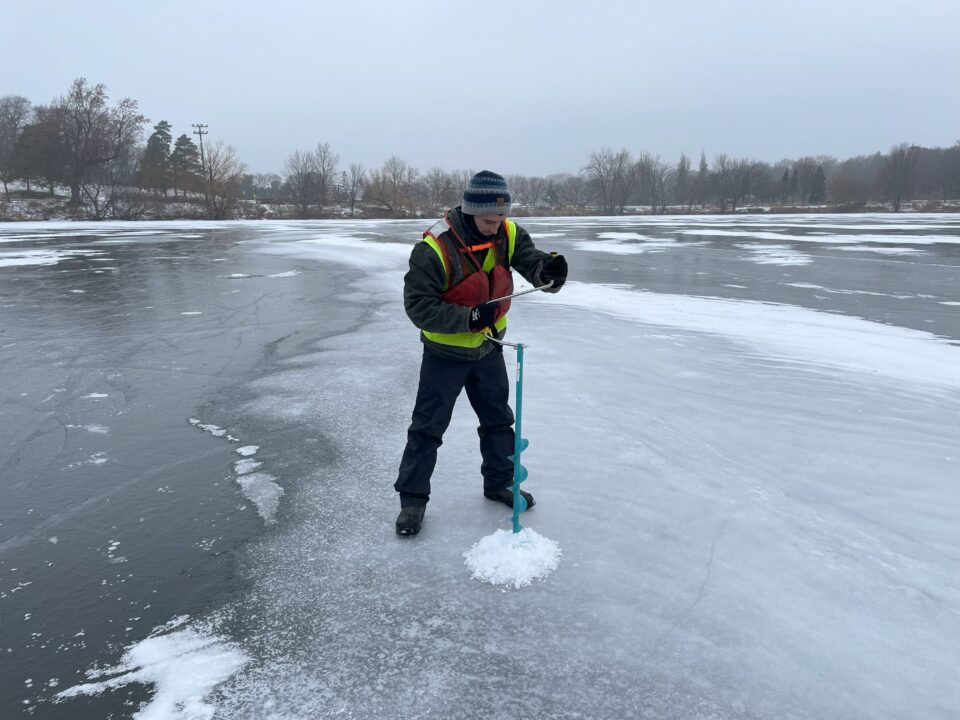
When it’s safe to go out on Como Lake, CRWD’s staff collect winter monitoring data every two weeks at three locations in the lake. Most years, this can begin in early to mid-January and last until sometime in March. Winters in Minnesota can be highly variable, as we are experiencing this year, so winter monitoring on Como Lake is dependent upon the conditions that allow enough ice to form for safe access. Before heading out to monitor the lake, staff track weather conditions. During each visit, they frequently check the ice thickness on the lake to ensure it’s at least four inches, the recommended thickness for being on the lake on foot per the MN Department of Natural Resources.
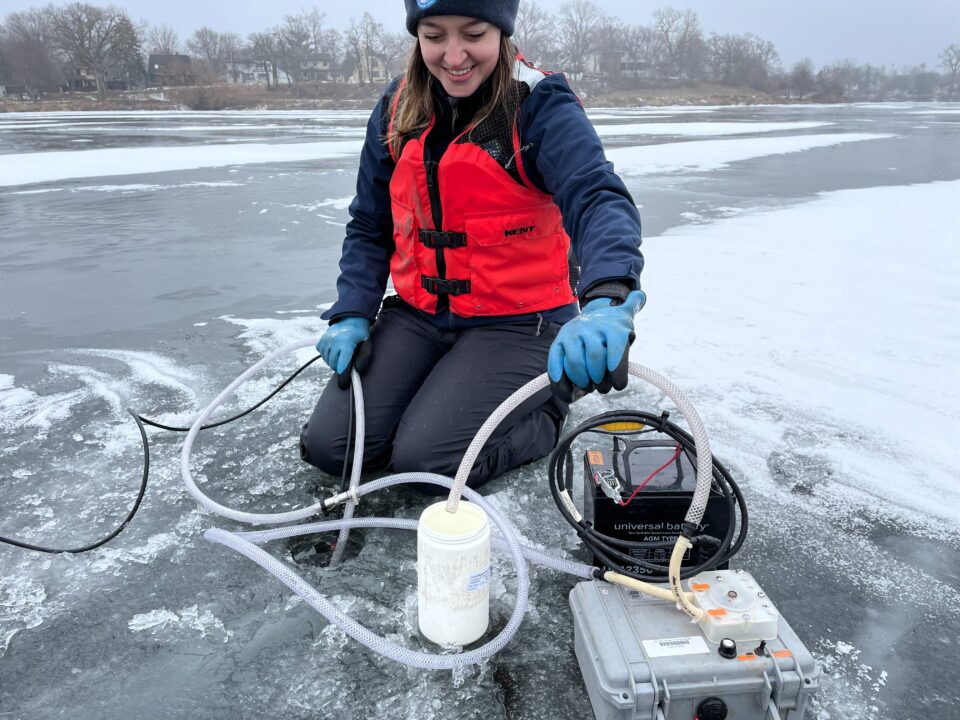
During each winter monitoring visit at Como Lake, staff use Global Positioning System (GPS) coordinates to find a precise location to drill a hole in the ice and collect data. Elizabeth pulls the equipment across the frozen lake on a plastic sled while Marta checks their GPS location. When they find the exact coordinate, they use a hand-cranked ice-auger to drill a three-inch diameter hole in the ice. Eoghan measures and records the ice thickness, then lowers the monitoring device into the lake. At each location, every half a meter from the surface to the bottom of the lake, they use a monitoring device to measure the dissolved oxygen, pH, conductivity, and temperature. Using a pump and tubing, they collect a water sample from the bottom of the lake and send the samples to a lab to determine the chloride level. The higher the level of dissolved chloride in the water, the saltier and heavier it is. The heavier, saltier water sinks to the bottom of the lake. From April to October, when the lake is ice-free, they track the same things at the same locations.
Chlorides in Como Lake
CRWD began monitoring Como Lake in the winter months about five years ago when the Minnesota Pollution Control Agency added it to the impaired waters list for excess chloride levels. Gathering data year-round at Como Lake gives us a better picture of what is happening within the lake. At Como Lake, chloride values usually increase throughout winter and early spring as rainwater runoff and melting snow carry road salt and deicers to the lake. Our monitoring data helps add to information about systems across the Twin Cities metro for how chloride affects lake health over time.
Phosphorus in Como Lake
During the winter, dissolved oxygen at the bottom of the lake can become depleted, and when it is too low, phosphorus is released from the bottom sediments back into the water column. The released phosphorus becomes food for algae in the spring and summer. In addition to allowing phosphorus to be released, lower levels of dissolved oxygen in the water harm aquatic animals and can kill fish. Ramsey County Department of Public Works staff track dissolved oxygen during the winter and install an aerator in Como Lake when needed to help prevent winter fish kills.
Monitoring Program
We monitor more than just Como Lake! CRWD staff begin winter monitoring at storm sewer pipe locations throughout the District in November after uninstalling seasonal equipment. We have about ten stations around the District where staff collect level or flow data year-round. This information helps us understand changes in the District throughout the year. When possible, we collect water samples during winter rainstorms and as snow melts each spring.
All the data gathered through CRWD’s monitoring program is used to assess the ongoing health of the District’s water resources. This information helps CRWD and its partners create water quality improvement solutions and develop educational programming. CRWD monitoring data also helps inform research studies.
What You Can Do
You can help keep sources of chloride and phosphorus out of Como Lake or your local body of water by taking simple actions. In the winter, follow best practices to use less salt on your sidewalks and driveway. Check out our blog on Tips for Better Snow and Ice Management.
Phosphorus, a pollutant carried to the lake through runoff in storm drains, comes from decaying organic matter like leaves, grass clippings, pet waste, and soil. You can sign up to adopt a storm drain (mn.adopt-a-drain.org/) near you and keep it clear of leaves, trash, and debris that runoff would otherwise carry to lakes like Como and the Mississippi River. In 2023, CRWD drain adopters cleared over 12,000 pounds of organic debris from their storm drains, the equivalent of keeping 6.6 pounds of algae out of our lakes and the Mississippi River.
Subscribe to our monthly newsletter to keep up-to-date with the latest CRWD news and events. Sign up at the footer of this page or by visiting our newsletter sign-up form.